---
title: "Food-security impact"
---
```{python}
#| label: setup
#| echo: false
import sys, pathlib
import pandas as pd
REPO_ROOT = None
for _cand in (pathlib.Path.cwd(), *pathlib.Path.cwd().parents):
if (_cand / "CLAUDE.md").exists() and (_cand / "viz").is_dir():
REPO_ROOT = _cand
sys.path.insert(0, str(_cand))
break
assert REPO_ROOT is not None, "could not locate repo root (CLAUDE.md + viz/)"
OUT = REPO_ROOT / "outputs"
nat = pd.read_csv(OUT / "food_security" / "impact_national.csv")
impact = pd.read_csv(OUT / "food_security" / "impact_by_aoi.csv")
tot = nat.loc[nat["aoi_id"] == "STUDY_TOTAL"].iloc[0]
n_govs = (nat["aoi_id"] != "STUDY_TOTAL").sum()
```
The primary question: **how much of the 2026 cereal recovery did the floods and fires
reverse, and where?** Damaged cropland hectares become an estimated production loss,
then an indicative food-security pressure, referenced against the 2025 drought
baseline.
::: {.key-findings}
### The answer
```{python}
#| label: headline
#| echo: false
from IPython.display import Markdown
Markdown(f"""
- **~{tot.production_loss_t_headline:,.0f} t** of cereal production lost across
**{n_govs} governorates** (3 flood AOIs + the national fire set), a lower bound.
Range **{tot.production_loss_t_low:,.0f}–{tot.production_loss_t_season_ref:,.0f} t**
from cropland-definition and temporal-aggregation sensitivity.
- That is **{tot.loss_pct_of_baseline_headline:.2f}%** of the combined 2025 baseline
({tot.baseline_production_2025_t:,.0f} t), about 2.16% of the national ~1.2 Mt floor.
- Indicative food-security pressure (study total): **{tot.food_security_pressure_indicative}**,
*not* an IPC phase (see method note).
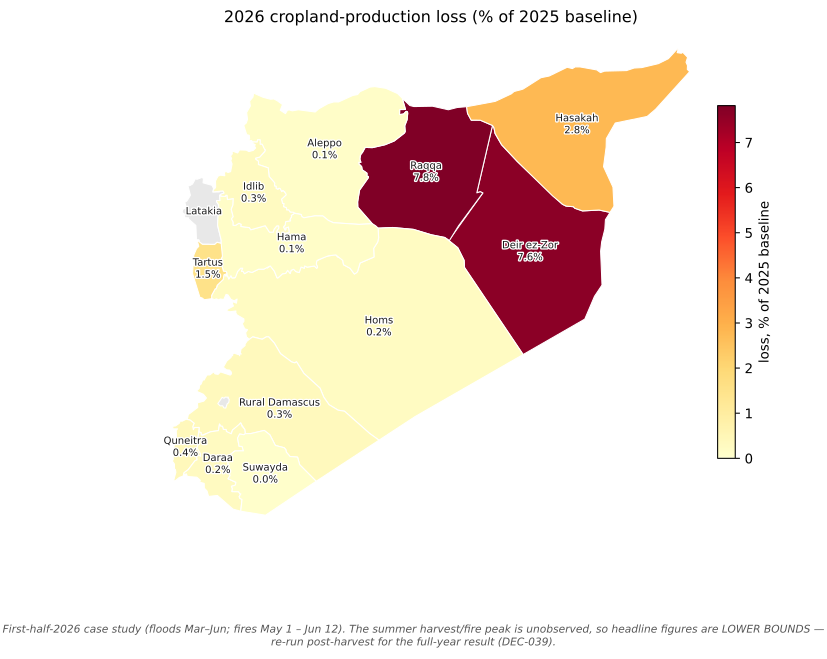
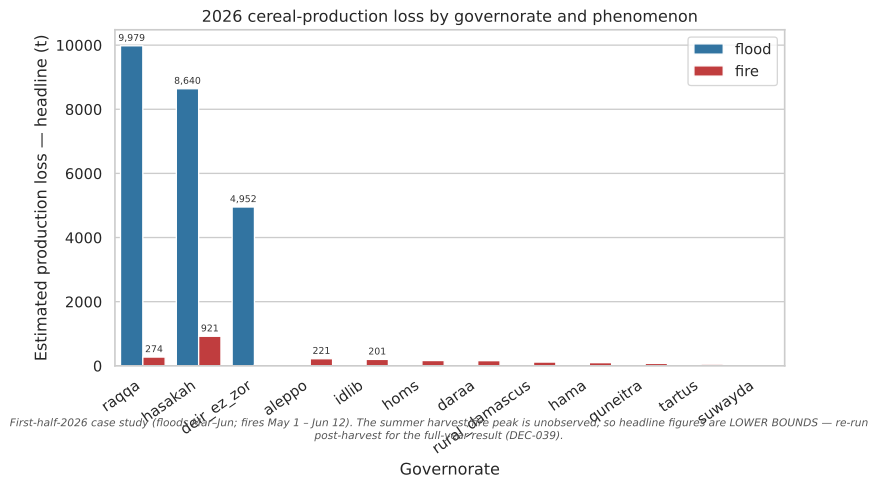
- The damage is **concentrated**: the two Euphrates flood AOIs (Raqqa, Deir ez-Zor)
each lose ~7–8% of their own baseline; the other nine governorates lose under 0.4%
each.
""")
```
:::
::: {.callout-important}
**First-half-2026 snapshot — figures are lower bounds.** Windows cover floods Mar–Jun
and fires May 1 – Jun 12. The harvest and fire season peaks in summer (Jun–Aug), so
the heaviest crop-fire months are unobserved. Re-run after the season closes for the
concluded result; field and expert verification is preferred over remote-sensing
self-consistency ([DEC-039](glossary.qmd#dec-039)).
:::
## Where the loss falls
```{python}
#| label: fig-loss-map
#| echo: false
#| fig-format: png
#| fig-dpi: 200
#| fig-cap: "Cereal-production loss as a share of each governorate's 2025 baseline. The Euphrates corridor carries the damage; Latakia and Damascus City are verified-excluded (grey). First-half-2026 lower bound."
#| fig-alt: "Choropleth map of Syria shaded by 2026 cropland-production loss as a percent of the 2025 baseline. Raqqa and Deir ez-Zor are darkest at about 7.6 to 7.8 percent, Hasakah mid-toned at 2.8 percent, all others pale under 1.5 percent, Latakia and Damascus City grey."
from viz import choropleth, caveat_footer, CAVEATS
import matplotlib.pyplot as plt
govs = nat[nat.aoi_id != "STUDY_TOTAL"]
vals = dict(zip(govs.aoi_id, govs.loss_pct_of_baseline_headline))
fig = choropleth(vals, title="2026 cropland-production loss (% of 2025 baseline)",
cbar_label="loss, % of 2025 baseline", value_fmt="{:.1f}%")
caveat_footer(fig, CAVEATS["case_study_2026h1"])
plt.show()
```
## The whiplash
The study's spine is a three-state sequence, **drought → tentative recovery →
shock**, and the question is how much of the recovery the 2026 shock took back.
| State | Cereal production | Note |
|---|---:|---|
| 2025 — record drought (baseline) | ~1.20 Mt | ~60%+ below average; worst in ~60 years (FAO/GIEWS) |
| 2026 — tentative recovery (projected) | ~2.30 Mt | more even rainfall; sowing targets not fully met |
| 2026 — observed first-half shock | see below | floods + fires, validated damage only |
The recovery figure is an external projection (context). The shock is measured here
from **human-validated damage records only**. The ~25.9 kt loss is about **2.4% of
the ~1.1 Mt recovery increment** the 2026 harvest was projected to add back: a real
dent in the rebound, not a reversal of it.
## Production loss by governorate
```{python}
#| label: fig-loss-by-aoi
#| fig-cap: "Estimated 2026 cereal-production loss (headline t) by governorate and phenomenon. Floods on the Euphrates dominate; the national fire set adds a broad but individually small contribution. First-half-2026 lower bound."
#| fig-alt: "Grouped bar chart of estimated 2026 cereal-production loss in tonnes by governorate, split into flood (blue) and fire (red). Raqqa, Hasakah and Deir ez-Zor have by far the largest flood losses (roughly 10,000, 8,600 and 5,000 tonnes); all fire bars are under about 920 tonnes."
import matplotlib.pyplot as plt
import seaborn as sns
from viz import apply_theme, caveat_footer, CAVEATS, PHENOMENON_COLORS, bar_value_labels

pal = {k.value: v for k, v in PHENOMENON_COLORS.items()}
apply_theme()
order = (impact.groupby("aoi_id")["production_loss_t_headline"].sum()
               .sort_values(ascending=False).index.tolist())
fig, ax = plt.subplots(figsize=(9, 5))
sns.barplot(
    impact, x="aoi_id", y="production_loss_t_headline", hue="phenomenon",
    hue_order=["flood", "fire"], order=order, palette=pal, ax=ax,
)
bar_value_labels(ax, fmt="{:,.0f}", threshold=200)
ax.set_xlabel("Governorate")
ax.set_ylabel("Estimated production loss — headline (t)")
ax.set_title("2026 cereal-production loss by governorate and phenomenon")
ax.tick_params(axis="x", rotation=35)
for lbl in ax.get_xticklabels():
    lbl.set_ha("right")
ax.legend(title="", loc="upper right", frameon=True)
caveat_footer(fig, CAVEATS["case_study_2026h1"])
plt.show()
```
[↓ Data behind this figure (impact_by_aoi.csv)](https://github.com/Muhanad-husn/flood-fire/blob/main/outputs/food_security/impact_by_aoi.csv){.data-download}
## Per-governorate detail
Loss as a share of each governorate's own 2025 baseline shows where the shock bites
hardest in *relative* terms. The three Euphrates/Khabur AOIs carry essentially all of
it; the nine fire-only governorates are individually marginal, so they are summarised
into one row below (the full 12-row table is one click away).
```{python}
#| label: tbl-per-aoi
#| echo: false
g = nat[nat["aoi_id"] != "STUDY_TOTAL"].copy()
prominent = g[g["food_security_pressure_indicative"] != "marginal"].copy()
marginal = g[g["food_security_pressure_indicative"] == "marginal"].copy()
prominent = prominent.sort_values("production_loss_t_headline", ascending=False)
summary = pd.DataFrame([{
"aoi_id": f"{len(marginal)} other governorates (each <0.4%)",
"baseline_production_2025_t": marginal["baseline_production_2025_t"].sum(),
"production_loss_t_headline": marginal["production_loss_t_headline"].sum(),
"production_loss_t_low": marginal["production_loss_t_low"].sum(),
"production_loss_t_season_ref": marginal["production_loss_t_season_ref"].sum(),
"loss_pct_of_baseline_headline": (
marginal["production_loss_t_headline"].sum()
/ marginal["baseline_production_2025_t"].sum() * 100),
"food_security_pressure_indicative": "marginal (combined)",
}])
cols = ["aoi_id", "baseline_production_2025_t", "production_loss_t_headline",
"production_loss_t_low", "production_loss_t_season_ref",
"loss_pct_of_baseline_headline", "food_security_pressure_indicative"]
view = pd.concat([prominent[cols], summary[cols]], ignore_index=True).rename(columns={
"aoi_id": "governorate",
"baseline_production_2025_t": "baseline 2025 (t)",
"production_loss_t_headline": "loss headline (t)",
"production_loss_t_low": "loss low (t)",
"production_loss_t_season_ref": "loss season-ref (t)",
"loss_pct_of_baseline_headline": "loss % of baseline",
"food_security_pressure_indicative": "indicative pressure",
})
(view.style.hide(axis="index")
.format({"baseline 2025 (t)": "{:,.0f}", "loss headline (t)": "{:,.1f}",
"loss low (t)": "{:,.1f}", "loss season-ref (t)": "{:,.1f}",
"loss % of baseline": "{:.2f}"})
.bar(subset=["loss % of baseline"], color="#9ecae1",
vmin=0, vmax=float(g["loss_pct_of_baseline_headline"].max())))
```
[↓ Full 12-governorate table (impact_national.csv)](https://github.com/Muhanad-husn/flood-fire/blob/main/outputs/food_security/impact_national.csv){.data-download}
## Fire damage by burn severity
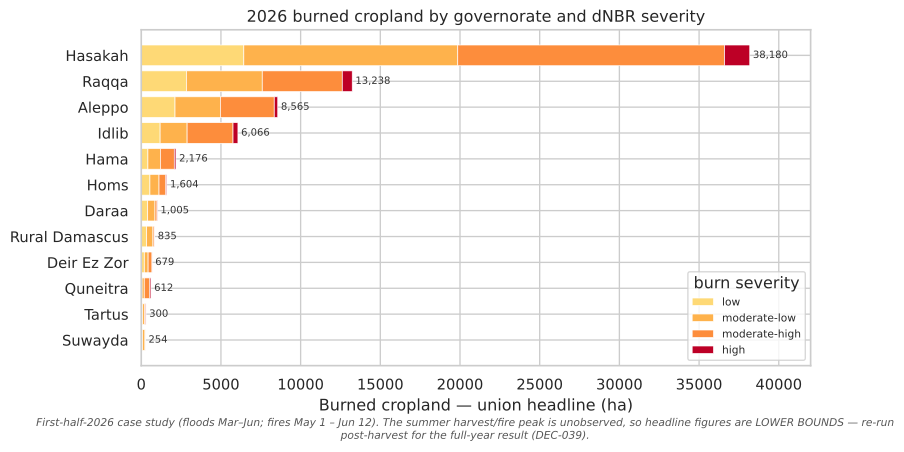
The headline counts burned-cropland hectares; this breaks them out by **dNBR burn
severity** (Key & Benson / USGS bins), the depth-of-burn signal behind the area. Most
burned cropland sits in the *low* and *moderate-low* classes — consistent with stubble
and field-edge fires rather than total crop loss — with high-severity hectares a small
tail. Severity is shown for the union-cropland headline; the
[Methods](technical.qmd) page explains the dNBR ∩ VIIRS chain.
```{python}
#| label: fig-fire-severity
#| echo: false
#| fig-cap: "Burned cropland (union-headline ha) by governorate and dNBR burn severity, 2026 study window (May 1 – Jun 12). Hasakah dominates the national fire signal; most hectares are low to moderate-low severity. First-half-2026 lower bound."
#| fig-alt: "Stacked horizontal bar chart of 2026 burned cropland in hectares by governorate, each bar split by burn severity from low (pale orange) to high (dark red). Hasakah has by far the longest bar at roughly 4,100 hectares, then Raqqa near 1,200, with most governorates under a few hundred hectares; low and moderate-low severity make up the bulk of every bar."
import matplotlib.pyplot as plt
from viz import apply_theme, caveat_footer, CAVEATS
sev = pd.read_csv(OUT / "tables" / "fire_damage_sensitivity.csv")
sev = sev[sev["is_study"]].copy()
SEV_ORDER = ["low", "moderate_low", "moderate_high", "high"]
SEV_COLORS = {"low": "#fed976", "moderate_low": "#feb24c",
"moderate_high": "#fd8d3c", "high": "#bd0026"}
SEV_LABEL = {"low": "low", "moderate_low": "moderate-low",
"moderate_high": "moderate-high", "high": "high"}
wide = (sev.pivot_table(index="aoi_id", columns="severity_class",
values="ha_union", aggfunc="sum", fill_value=0.0)
.reindex(columns=SEV_ORDER, fill_value=0.0))
wide = wide.loc[wide.sum(axis=1).sort_values().index] # ascending → biggest on top
labels = [a.replace("_", " ").title() for a in wide.index]
apply_theme()
fig, ax = plt.subplots(figsize=(9, 5))
left = pd.Series(0.0, index=wide.index)
for cls in SEV_ORDER:
ax.barh(labels, wide[cls], left=left.values, color=SEV_COLORS[cls],
edgecolor="white", linewidth=0.5, label=SEV_LABEL[cls])
left += wide[cls]
totals = wide.sum(axis=1)
for y, total in enumerate(totals.values):
ax.text(total, y, f" {total:,.0f}", va="center", ha="left",
fontsize=7.5, color="#333333")
ax.set_xlabel("Burned cropland — union headline (ha)")
ax.set_ylabel("")
ax.set_title("2026 burned cropland by governorate and dNBR severity")
ax.margins(x=0.10)
ax.legend(title="burn severity", loc="lower right", frameon=True, fontsize=8)
caveat_footer(fig, CAVEATS["case_study_2026h1"])
plt.show()
```
[↓ Data behind this figure (fire_damage_sensitivity.csv)](https://github.com/Muhanad-husn/flood-fire/blob/main/outputs/tables/fire_damage_sensitivity.csv){.data-download}
## Robustness — the headline without the RQ1-flagged hectares
[RQ1](rq1.qmd) flags Hasakah's June flood hectares as a likely radar harvest artifact
and excludes them from attribution. To keep the food-security number and the RQ1
attribution on the *same* record set, here is the study total recomputed with those
flagged dates removed (Hasakah's flood headline falls back to its attributed March
peak).
```{python}
#| label: excl-flagged
#| echo: false
events = pd.read_csv(OUT / "floods" / "rq1_attribution" / "event_mechanism.csv")
YIELD = float(impact["baseline_yield_t_ha"].iloc[0]) # DEC-019 drought-floor yield
attributed = events[events["mechanism"] != "unexplained"]
peak_attr = attributed.groupby("aoi_id")["flooded_cropland_ha_union"].max()
flood = impact[impact["phenomenon"] == "flood"].set_index("aoi_id")
removed_t = 0.0
for aoi, row in flood.iterrows():
new_ha = peak_attr.get(aoi, row["damaged_ha_headline_union"])
removed_t += row["production_loss_t_headline"] - new_ha * YIELD
headline = tot.production_loss_t_headline
excl = headline - removed_t
base = tot.baseline_production_2025_t
Markdown(f"""
| | Production loss | % of 2025 floor |
|---|---:|---:|
| **Headline (all validated records)** | ~{headline:,.0f} t | {headline/base*100:.2f}% |
| **Excluding RQ1-flagged Hasakah-June hectares** | ~{excl:,.0f} t | {excl/base*100:.2f}% |
| *Difference* | *−{removed_t:,.0f} t* | *−{removed_t/headline*100:.1f}%* |
""")
```
The headline is **robust to the flag**: removing the flagged hectares moves it only
about **5%**. That is because the layer already counts each AOI's **peak single flood
date**, not the sum of dates ([DEC-033](glossary.qmd#dec-033)), so the flagged June
dates never compounded, and the total is dominated by the well-supported Euphrates
records. We publish both figures rather than choosing one.
## Method, and what the numbers are not
::: {.callout-note collapse="true"}
## Method & provenance (expand)
- **Validated-only gate.** Only human-validated records are read; a single
non-validated record makes the layer refuse. No agent set any validation status:
the flood and fire gates were closed by a human ([DEC-007](glossary.qmd#dec-007)).
- **One cropland convention.** Union cropland is the headline, intersection the
conservative low bound ([DEC-015](glossary.qmd#dec-015)). Flood records (per
event-date) are collapsed to the **peak single event-date** so persistent pixels
are not double-counted across dates; the season-reference column is the upper
bracket ([DEC-033](glossary.qmd#dec-033)).
- **Loss = hectares × the 2025 drought-floor yield** (~0.223 t/ha,
[DEC-019](glossary.qmd#dec-019)). Applying the *drought-year* yield to 2026 damaged
area makes the loss a **conservative lower bound**: 2026 was a recovery year, so
expected yields on the lost hectares were higher.
- **Damage hectares inherit the pipeline caveats.** Flood extent is open-water
riverine inundation (flooded vegetation and pluvial upland under-detected,
[DEC-023](glossary.qmd#dec-023)); burned cropland is VIIRS-confirmed and a
conservative lower bound ([DEC-031](glossary.qmd#dec-031)).
:::
::: {.callout-warning}
**Not an IPC classification.** The indicative pressure is a qualitative band from
loss-as-%-of-baseline, **not** an IPC phase (which needs the full protocol:
consumption, livelihoods, nutrition, mortality). GIEWS, FEWS NET and IPC are the
authoritative sources; this layer is a production-shock signal that *feeds* such an
assessment. Syria's 2025 baseline was already a record-drought, Crisis-level context,
so the 2026 shock is **incremental** pressure on top of that.
:::
{{< include _footer.qmd >}}