---
title: "RQ1 — Flood attribution"
---
::: {.callout-tip appearance="simple"}
**In one line (1 of 3 research questions).** The 2026 cropland flooding splits
cleanly by river: the damaging June Euphrates flood is **upstream-sourced** water in a
rainless dry season, while Hasakah's June "flood" has no water source and is flagged
as a likely radar artifact. Whether the upstream release was natural or managed is not
resolvable from the available data.
:::
::: {.conf-strip}
[Source split (river geography)]{.conf-item} [HIGH]{.pill .pill-high}
· [Rainfall vs upstream magnitude]{.conf-item} [MED–HIGH]{.pill .pill-med}
· [Natural vs managed release]{.conf-item} [LOW]{.pill .pill-low}
:::
**Question.** How much of the 2026 flood is rainfall-driven versus driven by upstream
(transboundary) discharge, and is that discharge a natural high-flow or a managed dam
release? Discriminated with CHIRPS rainfall and GloFAS discharge against the 2025
drought baseline.
::: {.callout-note}
Attribution is provisional and carries explicit uncertainty. The Euphrates is
transboundary and the dam question is politically charged, so every causal statement
below is kept proportionate to the evidence ([§9](glossary.qmd)). GloFAS is a
hydrological *reanalysis* with limited reservoir modelling; it bounds the question, it
does not pinpoint a dam-release fraction.
:::
```{python}
#| label: setup
#| echo: false
import sys, pathlib
import pandas as pd
REPO_ROOT = None
for _cand in (pathlib.Path.cwd(), *pathlib.Path.cwd().parents):
if (_cand / "CLAUDE.md").exists() and (_cand / "viz").is_dir():
REPO_ROOT = _cand
sys.path.insert(0, str(_cand))
break
assert REPO_ROOT is not None, "could not locate repo root (CLAUDE.md + viz/)"
RQ1 = REPO_ROOT / "outputs" / "floods" / "rq1_attribution"
```
## Headline
The 2026 cropland flooding splits cleanly by **river geography**:
- **Euphrates AOIs (Deir ez-Zor, Raqqa) — upstream/transboundary, HIGH confidence.**
Flooding tracks elevated Euphrates discharge with **negligible local rainfall**. The
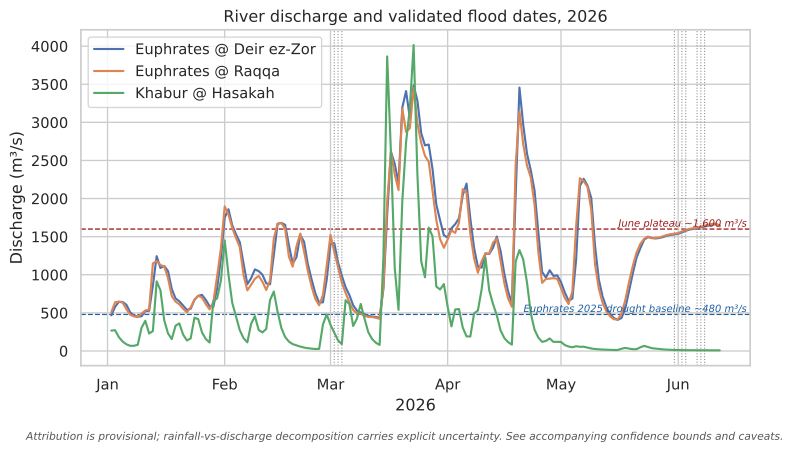
June inundation, which is the largest harvest-season damage, coincides with a
sustained **~1,600 m³/s plateau** (about 3× the ~480 m³/s drought-season baseline,
~6× the deep drought low) in the dry season when rainfall is zero. This water is
upstream-sourced.
- **Hasakah (Khabur) — two different stories.** The **March** flooding is a real
**rain-fed Khabur pulse** (discharge well above its ~16 m³/s baseline, with
wet-season rainfall), so regional rainfall. The **June** "flooding" has **no water
source** (Khabur ~8–12 m³/s, zero rainfall) and is **flagged as a likely radar
harvest artifact** ([DEC-023](glossary.qmd#dec-023)), not attributed.
## Rainfall vs upstream discharge
The June cropland inundation lands when the Euphrates holds a **rising dry-season
plateau**, exactly when local rainfall is zero. The Khabur (Hasakah) is essentially
dry in June. Vertical markers are the validated flood event-dates; the dashed lines
are the Euphrates drought baseline and the June plateau.
```{python}
#| label: fig-rainfall-vs-discharge
#| fig-cap: "Euphrates and Khabur 2026 daily discharge (GloFAS reanalysis) with validated flood event-dates marked. The June Euphrates plateau (~1,600 m³/s) is a dry-season high-flow at zero local rainfall, about 3× the ~480 m³/s drought baseline; the Khabur is near-dry in June."
#| fig-alt: "Line chart of 2026 daily river discharge for the Euphrates at Deir ez-Zor and Raqqa and the Khabur at Hasakah. The Euphrates lines rise to a sustained plateau near 1,600 cubic metres per second in late May and June, far above a dashed 480 baseline line; the Khabur line stays near zero. Dotted vertical lines mark validated flood dates clustering in March and June."
import matplotlib.pyplot as plt
import matplotlib.dates as mdates
from viz import apply_theme, caveat_footer, CAVEATS, baseline_line

q = pd.read_csv(RQ1 / "glofas_discharge_2026.csv", parse_dates=["date"])
events = pd.read_csv(RQ1 / "event_mechanism.csv", parse_dates=["event_date"])

reaches = {
    "euphrates_deir_ez_zor": "Euphrates @ Deir ez-Zor",
    "euphrates_raqqa": "Euphrates @ Raqqa",
    "khabur_hasakah": "Khabur @ Hasakah",
}
apply_theme()
fig, ax = plt.subplots(figsize=(9, 5))
for series, label in reaches.items():
    s = q[q["series"] == series].sort_values("date")
    ax.plot(s["date"], s["discharge_m3s"], label=label, linewidth=1.6)

for d in events["event_date"].unique():
    ax.axvline(pd.Timestamp(d), color="#888888", linestyle=":", linewidth=0.8)

baseline_line(ax, 480, "Euphrates 2025 drought baseline ~480 m³/s", color="#1f5fa0")
baseline_line(ax, 1600, "June plateau ~1,600 m³/s", color="#9b1c1c")

ax.set_xlabel("2026")
ax.set_ylabel("Discharge (m³/s)")
ax.set_title("River discharge and validated flood dates, 2026")
ax.xaxis.set_major_formatter(mdates.DateFormatter("%b"))
ax.legend(loc="upper left", frameon=True)
caveat_footer(fig, CAVEATS["attribution"])
plt.show()
```
[↓ Discharge series (glofas_discharge_2026.csv)](https://github.com/Muhanad-husn/flood-fire/blob/main/outputs/floods/rq1_attribution/glofas_discharge_2026.csv){.data-download}
## How the flood dates were chosen
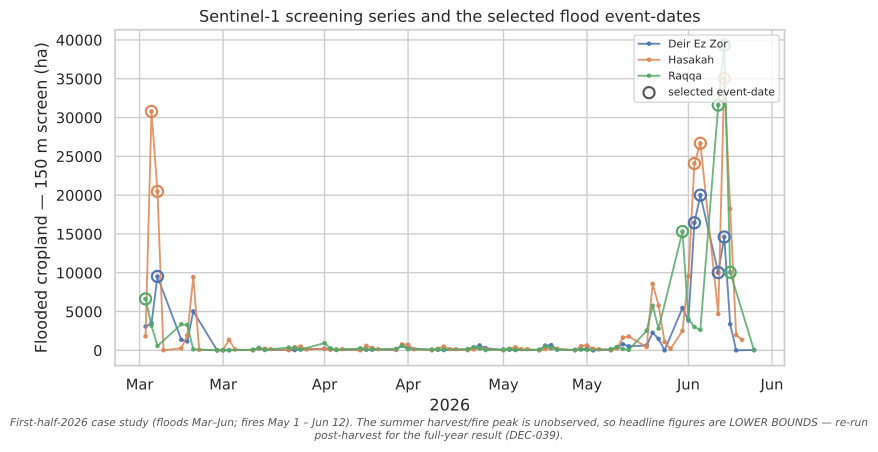
Sentinel-1 passes every ~6 days, and running a full 30 m export on every date is
expensive, so each date is first **screened** cheaply at 150 m for flooded-cropland
extent; only the peaks (the **event-dates**, marked below) get the full-resolution
export that produces the validated hectares ([DEC-024](glossary.qmd#dec-024)). The
screening series shows the structure attribution then explains: a **March** pulse and
a larger **June** rise on the Euphrates AOIs, against a low background the rest of the
season.
```{python}
#| label: fig-screening
#| echo: false
#| fig-cap: "Sentinel-1 screening series: daily flooded-cropland extent (150 m screen, ha) per AOI across the 2026 flood window, with the selected event-dates marked. Only event-dates are exported at 30 m for the validated damage records (DEC-024). First-half-2026 lower bound."
#| fig-alt: "Line chart of daily flooded-cropland screening extent in hectares for Deir ez-Zor, Raqqa and Hasakah from March to June 2026. Each line has a few sharp peaks; larger circular markers sit on the selected event-dates, clustered in early March and again in late May to June. Background extent between peaks is low."
import matplotlib.pyplot as plt
import matplotlib.dates as mdates
from viz import apply_theme, caveat_footer, CAVEATS
scr = pd.read_csv(RQ1.parent / "validation_packet" / "screening_series.csv",
parse_dates=["date"])
apply_theme()
fig, ax = plt.subplots(figsize=(9, 5))
for aoi in sorted(scr["aoi_id"].unique()):
s = scr[scr["aoi_id"] == aoi].sort_values("date")
label = aoi.replace("_", " ").title()
line, = ax.plot(s["date"], s["flooded_cropland_ha_screen"], linewidth=1.4,
marker="o", markersize=2.5, alpha=0.85, label=label)
ev = s[s["is_event"]]
ax.scatter(ev["date"], ev["flooded_cropland_ha_screen"], s=70,
facecolors="none", edgecolors=line.get_color(), linewidths=1.6,
zorder=5)
ax.scatter([], [], s=70, facecolors="none", edgecolors="#555555",
linewidths=1.6, label="selected event-date")
ax.set_xlabel("2026")
ax.set_ylabel("Flooded cropland — 150 m screen (ha)")
ax.set_title("Sentinel-1 screening series and the selected flood event-dates")
ax.xaxis.set_major_formatter(mdates.DateFormatter("%b"))
ax.legend(loc="upper right", frameon=True, fontsize=8)
caveat_footer(fig, CAVEATS["case_study_2026h1"])
plt.show()
```
[↓ Screening series (screening_series.csv)](https://github.com/Muhanad-husn/flood-fire/blob/main/outputs/floods/validation_packet/screening_series.csv){.data-download}
The screen is a deliberately cheap proxy (150 m, no HAND gate), so its absolute
hectares run higher than the validated 30 m figures — it is an **event-finder**, not
the damage measure. The validated extent comes only from the marked event-dates, after
the full chain in [Methods](technical.qmd).
## Per-event mechanism (the evidence)
Discharge is same-day at the draining reach; the ratio is versus the 2025 GloFAS
drought baseline; rainfall is AOI-mean over the prior 7 days. The **shaded rows are
the flagged Hasakah-June dates** with no identifiable water source.
```{python}
#| label: tbl-mechanism
#| echo: false
cols = ["aoi_id", "event_date", "flooded_cropland_ha_union", "chirps_mm_prev7d",
"discharge_m3s", "discharge_ratio_vs_baseline", "mechanism"]
tbl = events[cols].copy()
tbl["event_date"] = tbl["event_date"].dt.strftime("%Y-%m-%d")
view = tbl.rename(columns={
"aoi_id": "AOI", "event_date": "date",
"flooded_cropland_ha_union": "flooded ha (union)",
"chirps_mm_prev7d": "rain mm (7d)", "discharge_m3s": "discharge m³/s",
"discharge_ratio_vs_baseline": "× baseline", "mechanism": "mechanism",
})
def _flag_row(row):
flagged = row["mechanism"] == "unexplained"
return ["background-color: #fbe3e3; font-weight: 600" if flagged else ""] * len(row)
(view.style.hide(axis="index")
.apply(_flag_row, axis=1)
.format({"flooded ha (union)": "{:,.0f}", "rain mm (7d)": "{:.1f}",
"discharge m³/s": "{:,.0f}", "× baseline": "{:.2f}"}))
```
## Decomposition & confidence
- **Source split — [HIGH]{.pill .pill-high}.** River geography plus the
rainfall/discharge coincidence cleanly separate local-pluvial from riverine. The
June Euphrates flood is upstream-sourced (zero rainfall, sustained high discharge);
the March Khabur flood is regional-rainfall-driven.
- **Rainfall vs upstream magnitude — [MED–HIGH]{.pill .pill-med}.** For the Euphrates
AOIs, essentially all 2026 flood damage is riverine/upstream, not local rainfall.
- **Natural vs managed upstream release — [LOW]{.pill .pill-low} (do not overclaim).**
GloFAS cannot resolve dam operations. A natural hydrograph recedes through summer;
the observed **sustained, rising dry-season plateau** and the modelled-vs-reported
discharge gap are **consistent with** a managed-release contribution to the June
surge, aligning with the reported first-in-30-years spillway-gate opening, but **no
dam-release fraction is asserted**. Stated as consistency, not proof.
::: {.callout-warning}
**Flag — Hasakah June flood records (surfaced for the human, not silently resolved).**
Three validated Hasakah June flood dates (~25–39k ha union) have **no identifiable
water source** (Khabur ~8–12 m³/s, zero rainfall) and match the
[DEC-023](glossary.qmd#dec-023) radar harvest-artifact failure mode (smooth dry or
harvested June fields mimic open water in radar). RQ1 **excludes** these hectares from
attribution. Independent reporting corroborates the flag: FEWS NET put the *entire*
March 3-governorate inundation at **~1,500 ha**, an order of magnitude below the union
June-Hasakah figure, with no separate June Hasakah flood documented. A decisive
optical cross-check (Copernicus GFM / Sentinel-2 on 06-02/03/07) is recommended at the
post-harvest re-run. This does **not** overturn the food-security headline, which is
dominated by the well-supported Euphrates records, and which moves only ~5% when these
hectares are excluded (see [Food security](food_security.qmd)).
:::
## Caveats
- GloFAS is a ~0.05° hydrological **reanalysis**; reach values are model discharge
with limited reservoir representation, not gauge measurements.
- CHIRPS is AOI-mean at ~5.5 km ([DEC-017](glossary.qmd#dec-017)), so regional
rainfall, not field-scale; the upper-Khabur and Turkish headwater catchment is
outside the AOI mean, so the Khabur March pulse is read off discharge, not CHIRPS.
- Flood hectares are the open-water riverine extent ([DEC-023](glossary.qmd#dec-023)
caveats inherited); union and intersection cropland
([DEC-015](glossary.qmd#dec-015)) bracket the magnitude.
- The 2× discharge-ratio mechanism threshold is an analytical convention, not a
hydraulic flood threshold.
::: {.page-nav}
[← All three questions](rq.qmd)
[RQ2 — Fire attribution →](rq2.qmd)
:::
{{< include _footer.qmd >}}