---
title: "RQ2 — Fire attribution"
---
::: {.callout-tip appearance="simple"}
**In one line (2 of 3 research questions).** Are the 2026 crop fires concentrated
along conflict frontlines? We **cannot test 2026 directly** because ACLED conflict
data does not yet reach the 2026 window. On the latest covered year (2025), the method
shows crop fires sit **no closer to fighting than ordinary farmland is**, i.e.
agricultural and seasonal, not a frontline signal.
:::
::: {.conf-strip}
[Method works end-to-end (2025 demo)]{.conf-item} [HIGH]{.pill .pill-high}
· [2026 conflict linkage]{.conf-item} [DATA GAP — NOT YET ASSESSABLE]{.pill .pill-gap}
:::
**Question.** Are the 2026 crop fires concentrated along conflict frontlines and
linked to military activity, or do they track accidental and agricultural burning?
Tested by overlaying FIRMS/VIIRS hotspots and Sentinel-2 burn scars on ACLED conflict
events.
::: {.callout-important}
**Data-availability constraint — read first.** Live ACLED Syria coverage ends
**2025-06-13**, exactly one year behind the simulated "today" (2026-06-13). The 2026
study fire window therefore has **zero ACLED conflict events**, so the conflict
overlay for the validated 2026 fires **cannot be computed**. This is a
*data-availability gap*, **not** a finding of "no linkage". Separately, the domain
expert confirms there is **no active armed conflict** in the 2026 window, so 2026
fires are framed as an agricultural drought and heat hazard
([DEC-037](glossary.qmd#dec-037)), and RQ2's conflict overlay is moot for 2026 on
substantive grounds as well as data grounds.
:::
The full method is **built and demonstrated** on the latest ACLED-covered fire season
(**1 May – 13 Jun 2025**) over the fire AOIs. The 2025 run is a *method demonstration
on baseline/context data*, **not** a 2026 study finding. When ACLED ingests 2026 Syria
data, re-running over the study window produces the actual result with no code change.
```{python}
#| label: setup
#| echo: false
import sys, pathlib
import pandas as pd
REPO_ROOT = None
for _cand in (pathlib.Path.cwd(), *pathlib.Path.cwd().parents):
if (_cand / "CLAUDE.md").exists() and (_cand / "viz").is_dir():
REPO_ROOT = _cand
sys.path.insert(0, str(_cand))
break
assert REPO_ROOT is not None, "could not locate repo root (CLAUDE.md + viz/)"
RQ2 = REPO_ROOT / "outputs" / "fires" / "rq2_attribution"
```
## The honest control — distance to conflict vs the cropland null
::: {.callout-tip appearance="simple"}
**In plain terms:** we checked whether fires were closer to fighting than *ordinary
farmland* is. They were not. A raw "fraction of fires near conflict" looks alarming
only because fire and conflict both cluster in the inhabited and cropland belt; the
honest test is whether fires beat that shared-geography baseline.
:::
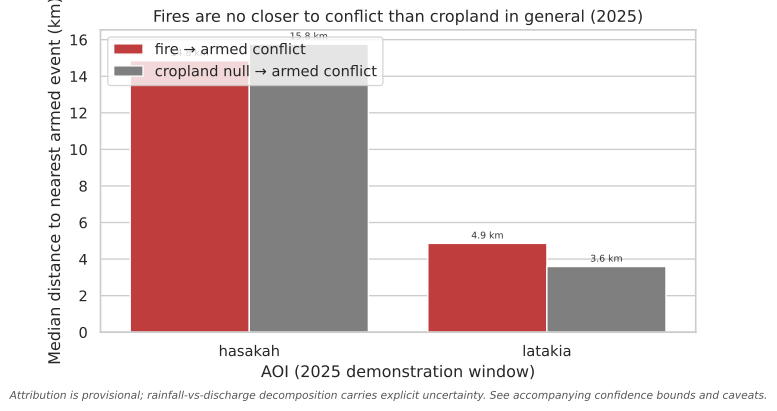
The load-bearing control is the **cropland null**: the distance from random *cropland*
pixels to the same armed-conflict events. If fires are **no closer** to conflict than
cropland is in general, the co-location is shared geography, not a frontline signal.
```{python}
#| label: fig-proximity
#| fig-cap: "2025 demonstration: median distance from fires to the nearest armed-conflict event versus the cropland-null median (random cropland pixels to the same events). Fires are no closer than cropland in general in both AOIs."
#| fig-alt: "Grouped bar chart for two AOIs (Hasakah and Latakia) comparing median distance to the nearest armed-conflict event for fires (red) versus the cropland null (grey). In Hasakah both are about 15 km; in Latakia the fire median (4.9 km) is slightly larger than the cropland null (3.6 km). In neither AOI are fires closer than cropland in general."
import matplotlib.pyplot as plt
import seaborn as sns
from viz import apply_theme, caveat_footer, CAVEATS, bar_value_labels

prox = pd.read_csv(RQ2 / "proximity_summary.csv")
demo = prox[prox["conflict_available"]].copy()  # 2025 rows only have a conflict overlay

long = demo.melt(
    id_vars="aoi_id",
    value_vars=["fire_median_km_to_armed", "cropland_null_median_km"],
    var_name="measure", value_name="median_km",
)
long["measure"] = long["measure"].map({
    "fire_median_km_to_armed": "fire → armed conflict",
    "cropland_null_median_km": "cropland null → armed conflict",
})
apply_theme()
fig, ax = plt.subplots(figsize=(8, 4.5))
sns.barplot(long, x="aoi_id", y="median_km", hue="measure",
            palette={"fire → armed conflict": "#d62728",
                     "cropland null → armed conflict": "#7f7f7f"}, ax=ax)
bar_value_labels(ax, fmt="{:.1f} km", threshold=0)
ax.set_xlabel("AOI (2025 demonstration window)")
ax.set_ylabel("Median distance to nearest armed event (km)")
ax.set_title("Fires are no closer to conflict than cropland in general (2025)")
ax.legend(title="", loc="upper left", frameon=True)
caveat_footer(fig, CAVEATS["attribution"])
plt.show()
```
[↓ Proximity summary (proximity_summary.csv)](https://github.com/Muhanad-husn/flood-fire/blob/main/outputs/fires/rq2_attribution/proximity_summary.csv){.data-download}
```{python}
#| label: tbl-proximity
#| echo: false
cols = ["aoi_id", "window", "n_fires", "n_armed_conflict",
"fire_median_km_to_armed", "cropland_null_median_km",
"closer_than_cropland_baseline", "coincidence_frac_armed_5km_7d",
"spearman_fire_vs_armed"]
tbl = prox[cols].copy()
# 2026 rows carry no ACLED overlay — make that explicit rather than printing NaN.
tbl["closer_than_cropland_baseline"] = tbl["closer_than_cropland_baseline"].map(
{True: "yes", False: "no"}).where(prox["conflict_available"], "n/a — no ACLED 2026")
view = tbl.rename(columns={
"aoi_id": "AOI", "window": "window", "n_fires": "fires",
"n_armed_conflict": "armed events",
"fire_median_km_to_armed": "fire median km",
"cropland_null_median_km": "cropland null km",
"closer_than_cropland_baseline": "closer than cropland?",
"coincidence_frac_armed_5km_7d": "coincident (5km, ±7d)",
"spearman_fire_vs_armed": "ρ(fire, armed/day)",
})
(view.style.hide(axis="index")
.format({"fire median km": "{:.1f}", "cropland null km": "{:.1f}",
"coincident (5km, ±7d)": "{:.0%}", "ρ(fire, armed/day)": "{:+.2f}"},
na_rep="—"))
```
*The 2026 rows show fire counts but **dashes for every conflict-distance column**:
there is no ACLED 2026 data to compute them against (a data gap, not a zero result).*
In both AOIs the 2025 fires are **no closer** to armed conflict than cropland is in
general (co-location explained by shared geography, not a frontline signal). Only a
small fraction of fires have an armed event within 5 km and ±7 days.
## Interpretation & confidence
- **Method works end-to-end — [HIGH]{.pill .pill-high}.** Proximity, space-time
coincidence, daily correlation, and the cropland-null control all compute over real
temporally-aligned data in the 2025 demonstration. The pipeline is ready for the
2026 study window the moment ACLED coverage reaches it.
- **2026 conflict linkage — [NOT YET ASSESSABLE]{.pill .pill-gap}.** No ACLED 2026
data means no overlay. Stated as a gap; we do **not** infer "fires are unrelated to
conflict".
- **What the 2025 demo can and cannot say.** Even where fires tested *closer* than the
cropland baseline, that would be **spatial association, not causation**: accidental
ignition during fighting, crop-burning as a tactic, and ordinary agricultural
burning in a conflict landscape are not separable by overlay geometry. PAX's
Sentinel-2 method is the named precedent for the descriptive overlay, not for a
causal claim.
::: {.callout-note}
The validated 2026 cropland-fire signal itself is real (~10.5k ha union across 12
governorates, Hasakah-dominant, see [Food security](food_security.qmd)). It is the
*conflict attribution* of those fires that awaits ACLED 2026 coverage; the fire damage
and its food-security impact stand on their own.
:::
## Caveats
- ACLED events are point-geocoded with variable precision (some to town centroids), so
"distance to nearest conflict" inherits that uncertainty. ACLED is proprietary,
cited and cached locally, never republished raw.
- "Frontline" is not a line in ACLED; it is approximated by the distribution of armed
events (Battles, Explosions/Remote violence, Violence against civilians).
- VIIRS detects active fire, not fire *cause*. The 2025 demo hotspots are
baseline/context, not study damage records.
- The cropland null samples the union mask within each AOI footprint with a fixed seed
(reproducible); the 0.75× "closer" rule is an analytical convention, not a
significance test.
::: {.page-nav}
[← RQ1 — Flood attribution](rq1.qmd)
[RQ3 — Damage vs control areas →](rq3.qmd)
:::
{{< include _footer.qmd >}}